 Trendium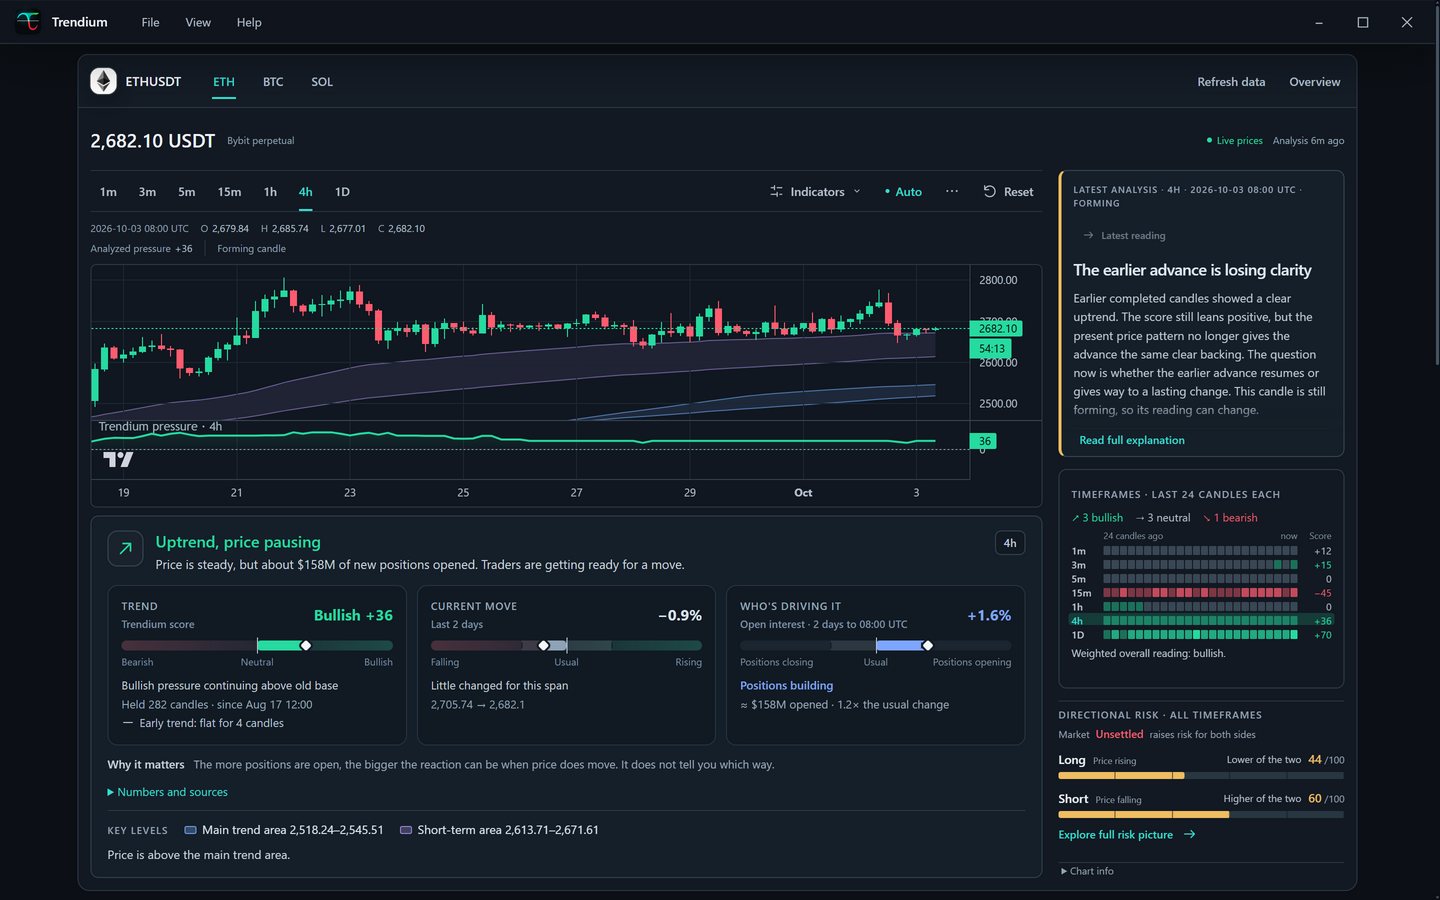
What is Trendium?
Trendium brings crypto market analysis and education together in one desktop app. Plain-language explanations and built-in lessons help you understand trend pressure, compare timeframes and recognize warning signs while following live markets.
It runs on Windows 10 and 11; macOS 12 or newer (Mac beta). Analysis is calculated on your computer using public exchange market data. No exchange account, private API keys or wallet access is needed.
Trendium does not provide financial advice, trading signals or trade execution. Its readings are not predictions.
Bitcoin, altcoins and meme coins listed on Bybit
Trendium gets its coin list from Bybit, so coins listed there can be displayed in the app. Build your watchlist around the markets you want to study, from BTC, ETH and SOL to listed meme coins. The information available in individual panels depends on the market data returned.
Start with the Bitcoin, Ethereum, Solana or meme-coin guides for practical context.
Seven timeframes, one comparison
Read 1m, 3m, 5m, 15m, 1h, 4h and 1D together. The timeframe ribbon shows the last 24 readings of each, helping you see which horizons agree and which differ. A short move and a broader trend can point in different directions.
A trend score beside the actual price move
The Trendium score summarizes the direction and strength of pressure. The current move adds the price change over the period shown. A plain-language explanation describes the conditions, while seven days of combined pressure history show how the reading developed.
Open-interest context from three exchanges
Open-interest changes add a view of outstanding derivatives positions beside the price reading. The app explains whether positions appear to be building or closing in the data shown. This aggregate information cannot identify individual buyers or sellers, and three exchanges do not represent every market venue.
Warnings for the long side and the short side
Directional risk panels compare warning signs side by side, each with a score out of 100 and an explanation. A clear trend can still have warning signs. These numbers are app readings, not loss probabilities or instructions to trade.
Your watchlist, with lessons built in
The overview brings your followed markets into cards showing the trend, current move, combined history, timeframe agreement and risk. Open a market’s fuller reading to inspect the details.
Eleven short lessons offer simple explanations, practical examples and deeper reading. Learn a concept, explore it in the app’s current market readings, and revisit it as conditions change. The online guides give you another way to build that understanding at your own pace.
Monthly or lifetime access
Website purchases offer USD 7 per month or $49 one time for lifetime access. Both plans include all the features, for one computer at a time. Your currency and any tax are shown at checkout.
After a website purchase through Whop, activate the app with your license key. Microsoft Store copies use your Microsoft account and do not need a license key. The Mac version is in beta. See downloads and system requirements and activation support.
The 7-day guarantee covers an app that does not work on your computer when support cannot fix it. It does not cover change of mind or trading results.