 Trendium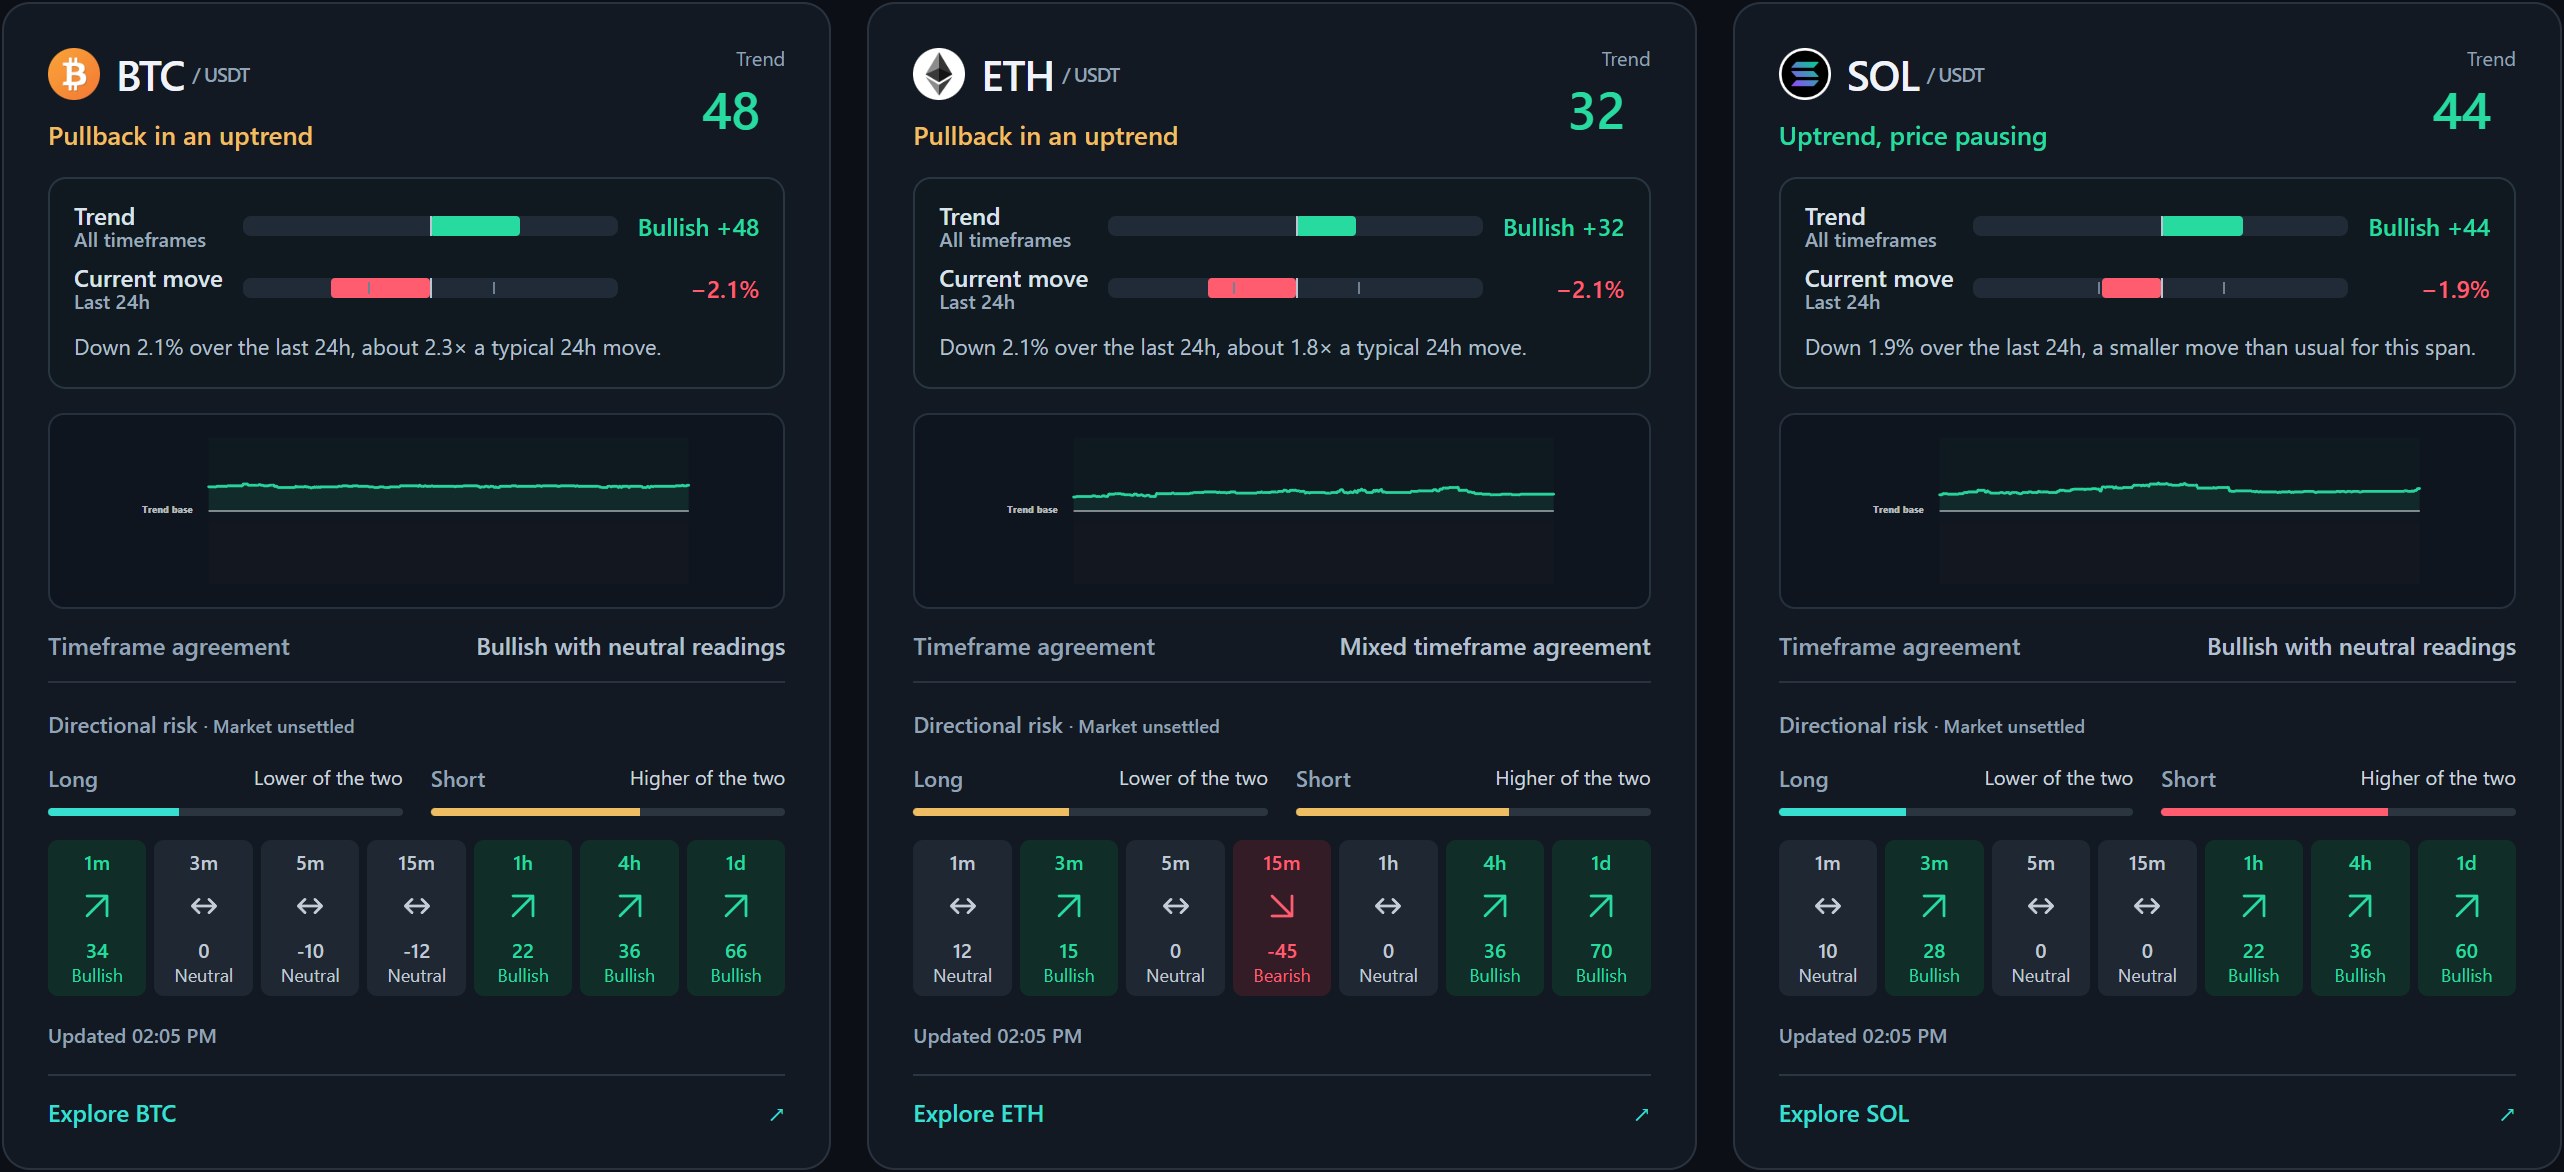
1. Name the market and confirm the data
Start with the market you intend to inspect. Confirm that the displayed information is available and current before interpreting it. If the app reports missing or outdated data, stop the interpretation and check your connection or contact support.
A gap in exchange data is not a neutral, bullish or bearish market state. Keep data quality separate from the interpretation of the numbers.
2. Read direction and the current move separately
Record the trend score, the selected timeframe and the current move over the period shown. Is price moving in the same direction as the broader reading, or is it pausing or moving against it?
Write one sentence describing what is on screen. Avoid adding an outcome the app has not established. “The reading leans up while the latest move is down” is an observation. “It will bounce” is a forecast.
3. Compare the seven timeframes
Look at 1m, 3m, 5m, 15m, 1h, 4h and 1D in the timeframe ribbon. Note where they agree and where they pull apart. Follow the recent readings within each row to see whether a change has persisted.
Do not pick only the row that agrees with your expectation. Mixed readings are information about different horizons, not something you need to force into one label.
4. Put the latest reading beside the week of history
The combined pressure history shows how the reading across the seven timeframes has developed over the last seven days. Compare the latest point with the earlier pattern: has pressure held, faded or turned?
A week of history is a defined window. It does not describe every prior market cycle or establish how a future move will develop. Use it to give the latest reading context.
5. Inspect open interest and both risk panels
Read the open-interest change with its period and explanation. Does outstanding exposure appear to be building or declining in the data shown? Avoid inferring the identities or intentions of individual traders.
Then compare the long-side and short-side warning signs. Record the explanation as well as the number. A strong trend reading does not remove the need to understand the warnings.
6. Save an observation you can compare later
Use this note format: market; observation time; selected timeframe; trend score; current move and its period; timeframe agreement; open-interest change and its period; long-side warnings; short-side warnings; data limitations.
On your next review, compare the same fields for the same market. The purpose is to learn how readings change and what you missed, not to award yourself a win for a prediction. The app’s eleven built-in lessons can help explain individual panels as you go.
You can use the watchlist overview to choose which market to inspect next, but an overview card is a summary. Open the fuller reading before making conclusions about the details. Trendium is a market-awareness tool, not financial advice.