 Trendium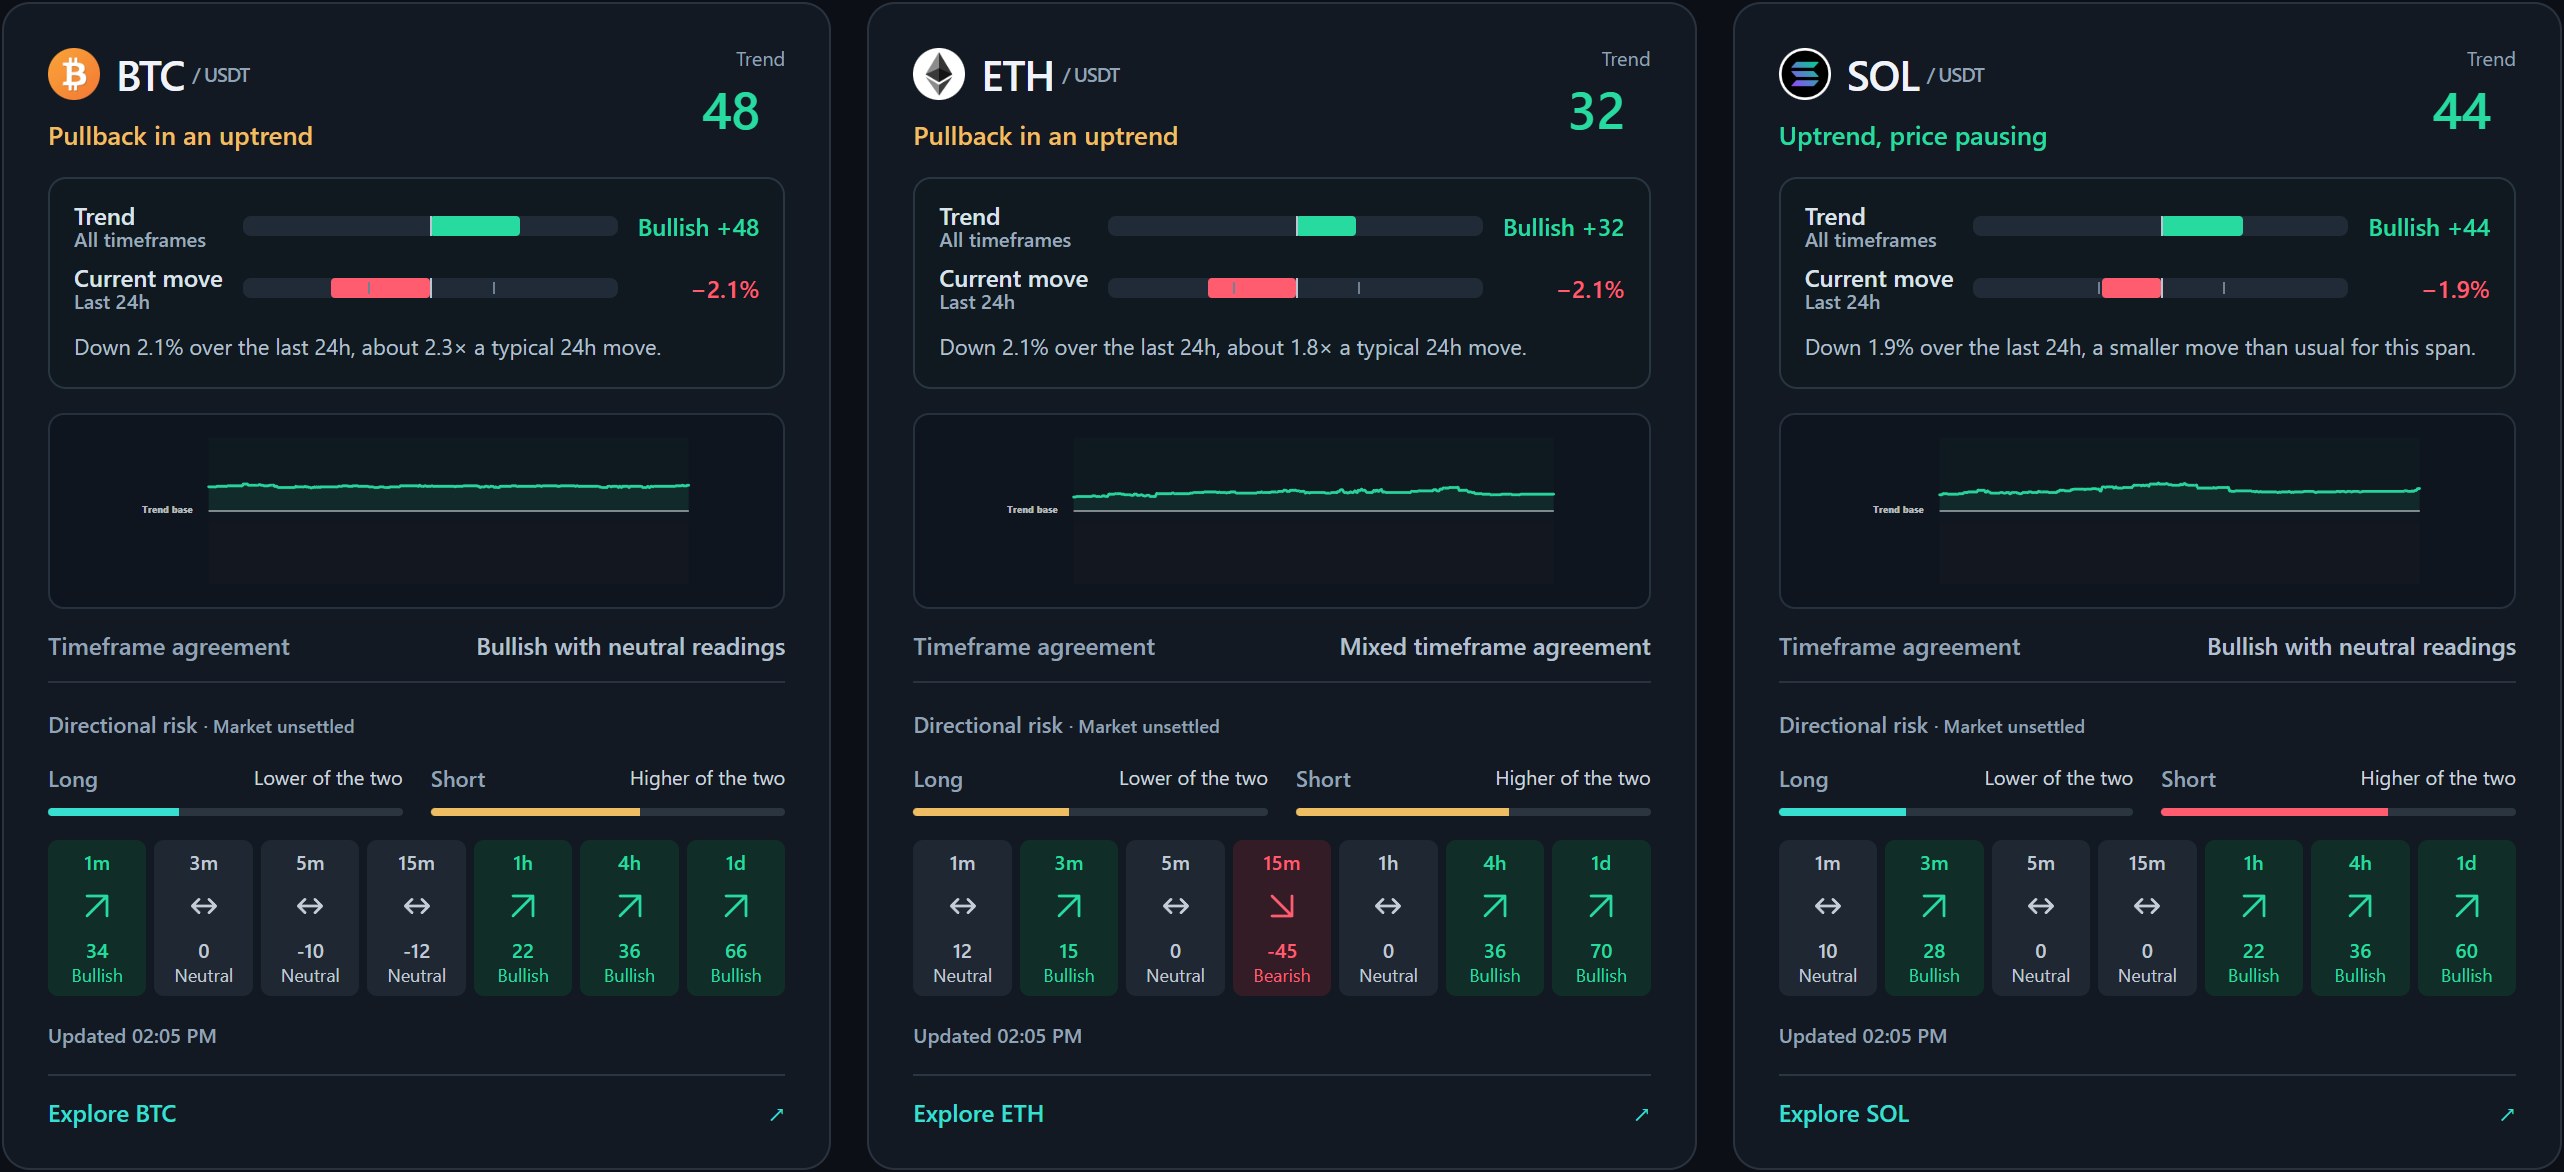
What is Solana, and what is SOL?
Solana is a blockchain network used for applications and digital assets. SOL is its native asset, used for network transaction fees and participation in network security. Solana also hosts other tokens that are distinct from SOL. Solana’s introductory guide explains these concepts.
A SOL exchange chart describes one market for the native asset. It does not describe the price or safety of every application, token or meme coin in the Solana ecosystem.
A SOL move is not the whole ecosystem
If a Solana-based token rises, that does not establish that SOL rose over the same period. Likewise, a SOL rally does not mean every token on the network gained. Specify the asset rather than using “Solana” as a catch-all market label.
When comparing SOL with BTC or ETH, check the quote currency and time window. When comparing SOL with a meme coin, also check that the market and instrument exist in your data source. A shared blockchain is not a shared market reading.
A concrete SOL example from the watchlist
The existing overview screenshot shows SOL/USDT with a Bullish +44 combined reading and a current move of −1.9% over 24 hours. The card calls this “Uptrend, price pausing” and describes the price move as smaller than usual for that span.
The BTC card in the same screenshot shows a −2.1% move described as larger than typical for BTC. This illustrates an important distinction: similar percentages can have different context relative to each market’s own usual movement. These are captured examples, not current SOL or BTC readings.
Timeframe agreement adds a second comparison
The SOL example has neutral shorter readings alongside bullish 1-hour, 4-hour and daily readings. The phrase “bullish with neutral readings” preserves that difference instead of implying a single uniform state.
Compare the timeframe rows, then read both directional risk explanations. A bullish combined reading and a comparatively small price pause do not establish that a long position is safe.
What Trendium adds to a SOL review
Trendium puts the trend, current move, timeframe agreement, combined history and risk on an overview card, with fuller detail in the market reading. That helps you write a more complete observation than “SOL is down today.”
For network research, use the project’s documentation separately. For market context, use the observation checklist. The app does not assess validator performance, audit Solana tokens or establish why a news event changed price. Its purpose is educational market awareness, not a SOL price prediction.