 Trendium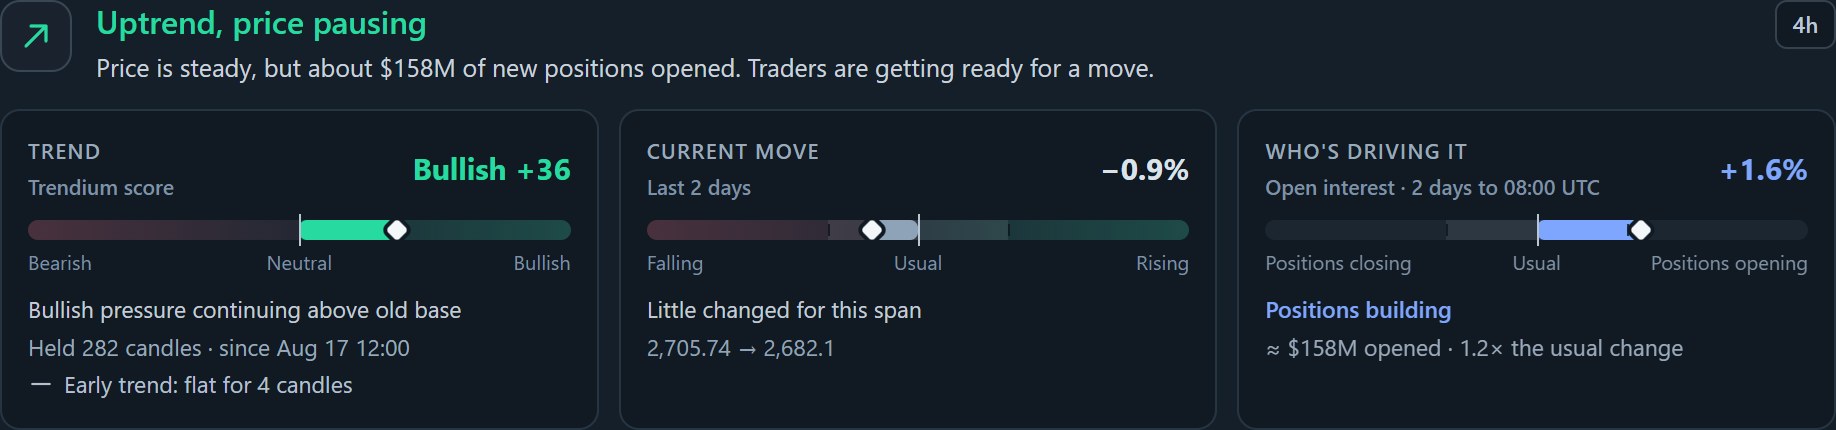
What does a crypto trend tell you?
A trend describes the direction of a market over a particular period. It does not tell you what the next candle will do. A market can have an upward broader trend while its latest move is downward. Those observations can both be true because they describe different parts of the price history.
Start by naming the market and timeframe. “Ethereum is bullish” leaves out important context. “The Ethereum reading on the 4-hour chart leans bullish, while the latest move is down” is a more specific observation you can compare with later readings.
Separate direction, strength and the current move
In Trendium, the score describes which way pressure leans and how strong that reading is. The current move describes what price has done over the period shown. Read both, then read the explanation beside them.
A bullish score does not make every price dip a buying opportunity. A bearish score does not mean that every bounce will fail. Treat the labels as descriptions of conditions, and check what the other timeframes and risk panels say before drawing a conclusion.
A worked example from the app
The screenshot above shows Ethereum with a Bullish +36 trend reading and a current move of −0.9% over the last two days. It also describes the price as pausing within an uptrend. The negative price change and bullish reading are not necessarily contradictory: the recent pause is being shown alongside the wider pressure reading.
This is an example captured from the app, not a live quote or a recommendation. Another reading could show a different score, timeframe or explanation. The useful habit is to describe the relationship between the numbers rather than treating one number as the whole story.
Check whether the wider picture agrees
Compare the selected timeframe with the seven-timeframe ribbon. Then look at the week of combined pressure history. Has the broader reading held, weakened or changed direction? A single screenshot cannot show how a reading develops; history adds that missing context.
Next, look at open interest and the risk on both sides. Agreement between panels can make the description clearer, but it still does not establish a future outcome.
A simple observation exercise
Write down the market, timeframe, score, current move and the app’s plain-language explanation. Revisit the same market later and record what changed. Did pressure strengthen while price paused? Did the short timeframes change before the longer ones? This gives you a concrete way to learn the interface without turning the exercise into a trade.
Trendium is an educational crypto market analysis app for Windows and Mac beta. It does not place trades, provide trading signals or promise profitable results. A trend reading is context, not financial advice.