 Trendium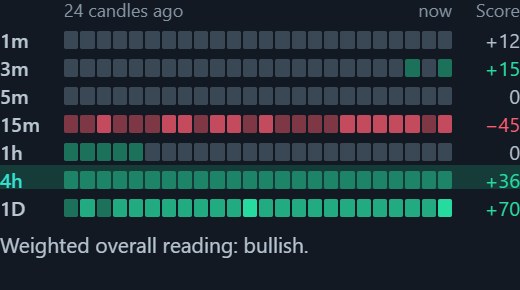
The seven timeframes in Trendium
Trendium reads 1 minute, 3 minutes, 5 minutes, 15 minutes, 1 hour, 4 hours and 1 day at once. The ribbon displays the last 24 readings of each timeframe, so you can compare recent changes across horizons instead of repeatedly switching between separate views.
The shorter timeframes show more immediate changes. The longer ones put those changes into a wider window. Neither group replaces the other: they answer different questions about the same market.
Why one timeframe can be bullish while another is bearish
Imagine a market that has been moving upward over a broader period but falls during a short stretch. A short-timeframe reading may turn bearish while the longer view still leans bullish. That disagreement describes a short move inside a larger one; it is not automatically a data error.
The reverse can happen too. A brief rally can appear in shorter readings while the broader market remains weak. Calling every short rally a new uptrend overlooks the period being measured. Name the timeframe whenever you describe a reading.
Read the ribbon in two directions
First, compare timeframes at the latest reading. Where do they agree, and where do they differ? Then follow each row across its recent history. Did a change appear in one row and persist, or did it disappear quickly?
The last 24 readings of each row are a sequence for that timeframe. Do not assume they cover an identical span of clock time across all seven rows. Use the labels and the combined history panel to keep your comparison grounded in the periods actually shown.
A practice example: short weakness, broader strength
Suppose the 1-minute and 5-minute readings lean down while the 4-hour and daily readings lean up. A useful description is “shorter readings are weakening while the broader readings still lean upward.” That records the disagreement without claiming the pause will end or the broader trend will reverse.
Next, check the current move and the plain-language analysis. Compare the directional risk panels rather than choosing the timeframe that supports a decision you already wanted to make. This example is hypothetical, not an entry rule.
Agreement is context, not certainty
Even if all seven timeframes lean in the same direction, they are still readings of one market and overlapping price history. They are not seven independent guarantees. Conditions can change, and a clear trend can coexist with warning signs.
There is no universally best crypto timeframe. A useful comparison keeps the observation period consistent with the question you are asking. Start with the trend-reading guide, then use the market observation checklist to build a repeatable review.