 Trendium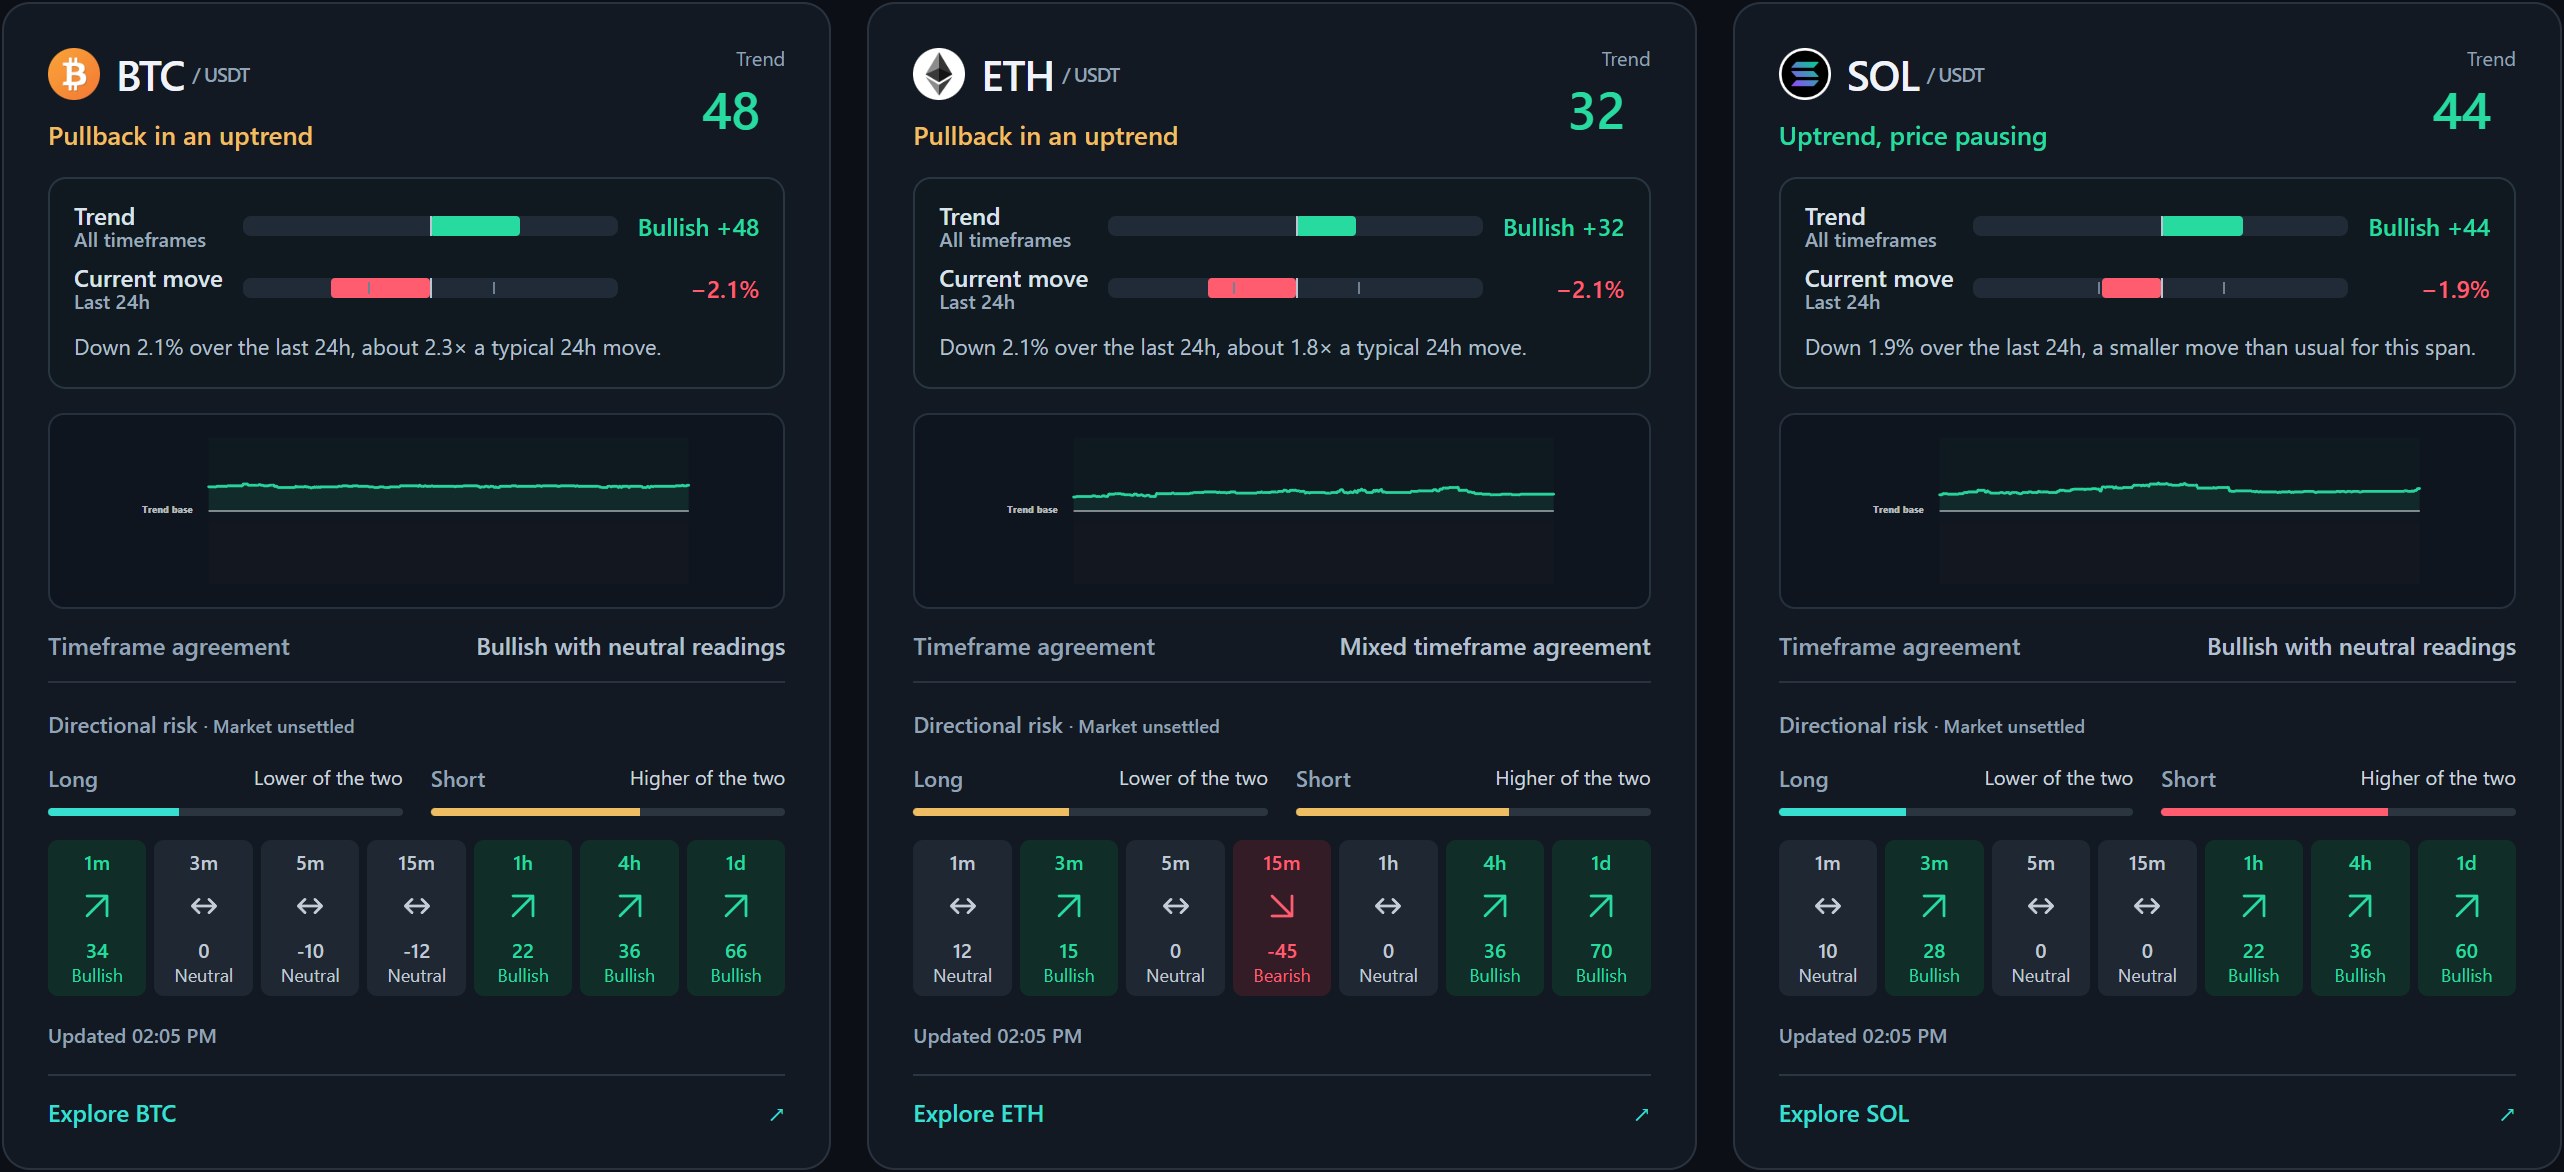
What is Bitcoin, and what does BTC mean?
Bitcoin is a decentralized digital payment network, and BTC is the ticker commonly used for its currency. Its public ledger records transactions, while mining is part of the process that maintains the network. Bitcoin.org’s FAQ explains the network and its basic terminology.
Those facts describe the asset. They do not explain whether the particular BTC market you are looking at is currently trending, pausing or changing direction. Network research and market observation answer different questions.
Read the pair before comparing a Bitcoin chart
BTC/USDT means Bitcoin is being quoted in USDT. BTC/USD and BTC/USDT are not identical labels, and a spot pair is not the same instrument as a perpetual futures contract. Exchange, quote currency, instrument and observation period all matter when comparing readings.
If two screens show different Bitcoin prices or percentage moves, first check that they refer to the same pair and period. A difference is not automatically a faulty chart. See spot versus perpetual futures for the instrument distinction.
A Bitcoin pullback example from Trendium
The existing watchlist screenshot shows BTC/USDT with a Bullish +48 combined reading while the current move is −2.1% over the last 24 hours. The card labels this “Pullback in an uptrend.” It also describes the move as about 2.3 times a typical 24-hour move.
The point is the combination: a negative daily price change appears alongside a broader upward reading. This captured example does not establish that the pullback will end or that Bitcoin will rise. It shows why the price change and the trend score should be read separately.
Check the timeframe disagreement
In that same example, several shorter rows are neutral while the 1-hour, 4-hour and daily rows lean bullish. “Bullish with neutral readings” describes that mixed picture more accurately than a blanket claim that every timeframe is rising.
Open the fuller Bitcoin reading to inspect the seven timeframes, the current move and the combined history. Compare open interest and the risk explanations next. The screenshot’s values are examples, not live market data.
Use Bitcoin as context without making it a rule
When comparing BTC with ETH or SOL, use the same time window and quote currency. A stronger Bitcoin price move does not tell you that every altcoin will follow it. A weaker move does not prove that another coin’s rise is sustainable.
Record what each market actually shows. The altcoin comparison guide explains the difference between a larger percentage move, relative performance and a Trendium score. Trendium is a desktop market-awareness app; it does not predict Bitcoin prices or place trades.