 Trendium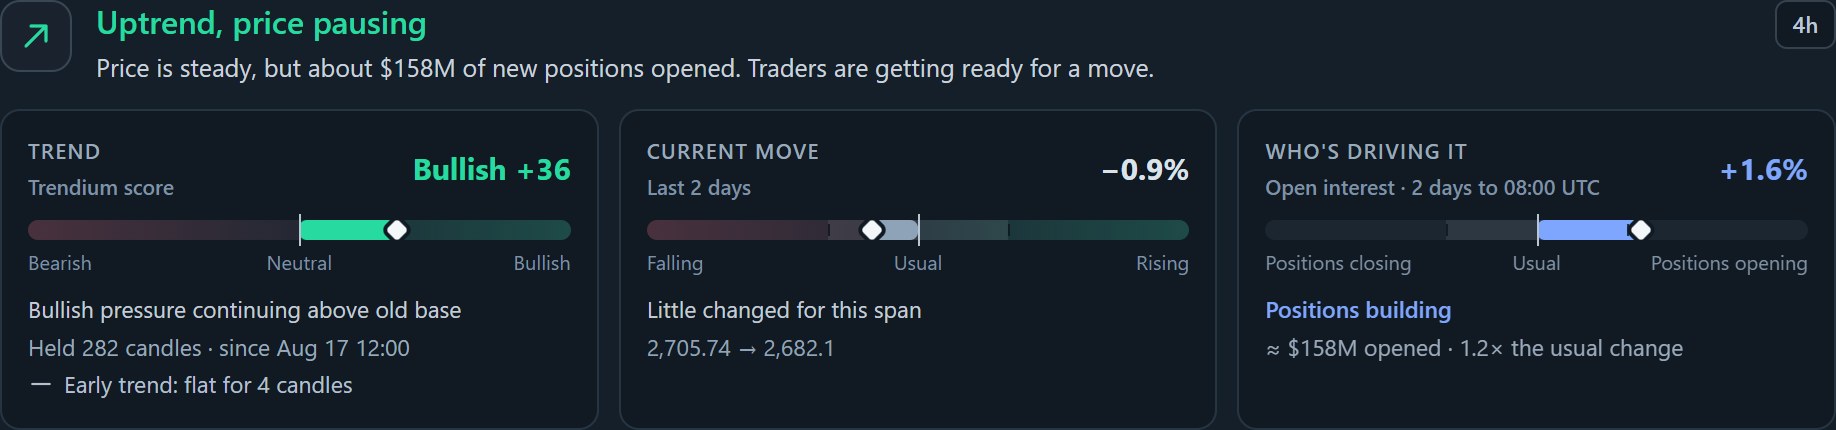
Ethereum is the network; ether is the asset
Ethereum is a blockchain platform for applications, including smart contracts. Ether, usually written ETH, is its native cryptocurrency. ETH is used for transaction fees, often called gas, and in the network’s staking system. Ethereum.org’s introduction explains these roles.
A token built on Ethereum is not automatically ETH. When reading an exchange market, check the ticker and pair rather than assuming that every Ethereum-related token describes the same asset.
Gas fees are different from the ETH exchange price
A gas fee is a cost for using the network. An exchange price is the amount quoted for ETH in another asset or currency. A chart of ETH/USDT is not a chart of gas fees, and a change in network activity is not by itself a complete explanation for a price move.
Keep project news as background, then describe what the market data shows. Trendium’s market reading is not an on-chain activity report or an assessment of an Ethereum application’s safety.
Read the Ethereum example in the app
The website’s Ethereum screenshot shows a Bullish +36 trend reading on the 4-hour view, a current move of −0.9% over the last two days, and a description of price pausing in an uptrend. A small downward move and an upward pressure reading can coexist because the panels describe different aspects of the market.
Read the period beside the change. A two-day move is not directly comparable with a 24-hour move unless you adjust the comparison. The screenshot is a captured interface example, not a current ETH forecast.
Add positions and timeframe context
The example also shows open interest up 1.6% over two days, described as positions building. That adds outstanding-position context, but it does not prove that all new positions are long or that a particular institution bought ETH.
Use the open-interest explanation to understand that limit, then compare the timeframe ribbon. ETH can have a different combination of short and broad readings from BTC even when their latest percentage moves look similar.
An ETH learning exercise
Write down ETH’s pair, selected timeframe, trend score, current move and its period. Add the long-side and short-side warnings in your own words. Revisit the same fields later before deciding whether your earlier description still applies.
For a comparison, use Bitcoin’s reading over the same observation window. Avoid treating an Ethereum network announcement, a bullish score or a single price candle as a promise of an outcome. Trendium helps explain market conditions; it does not provide financial advice, staking services or trade execution.