 Trendium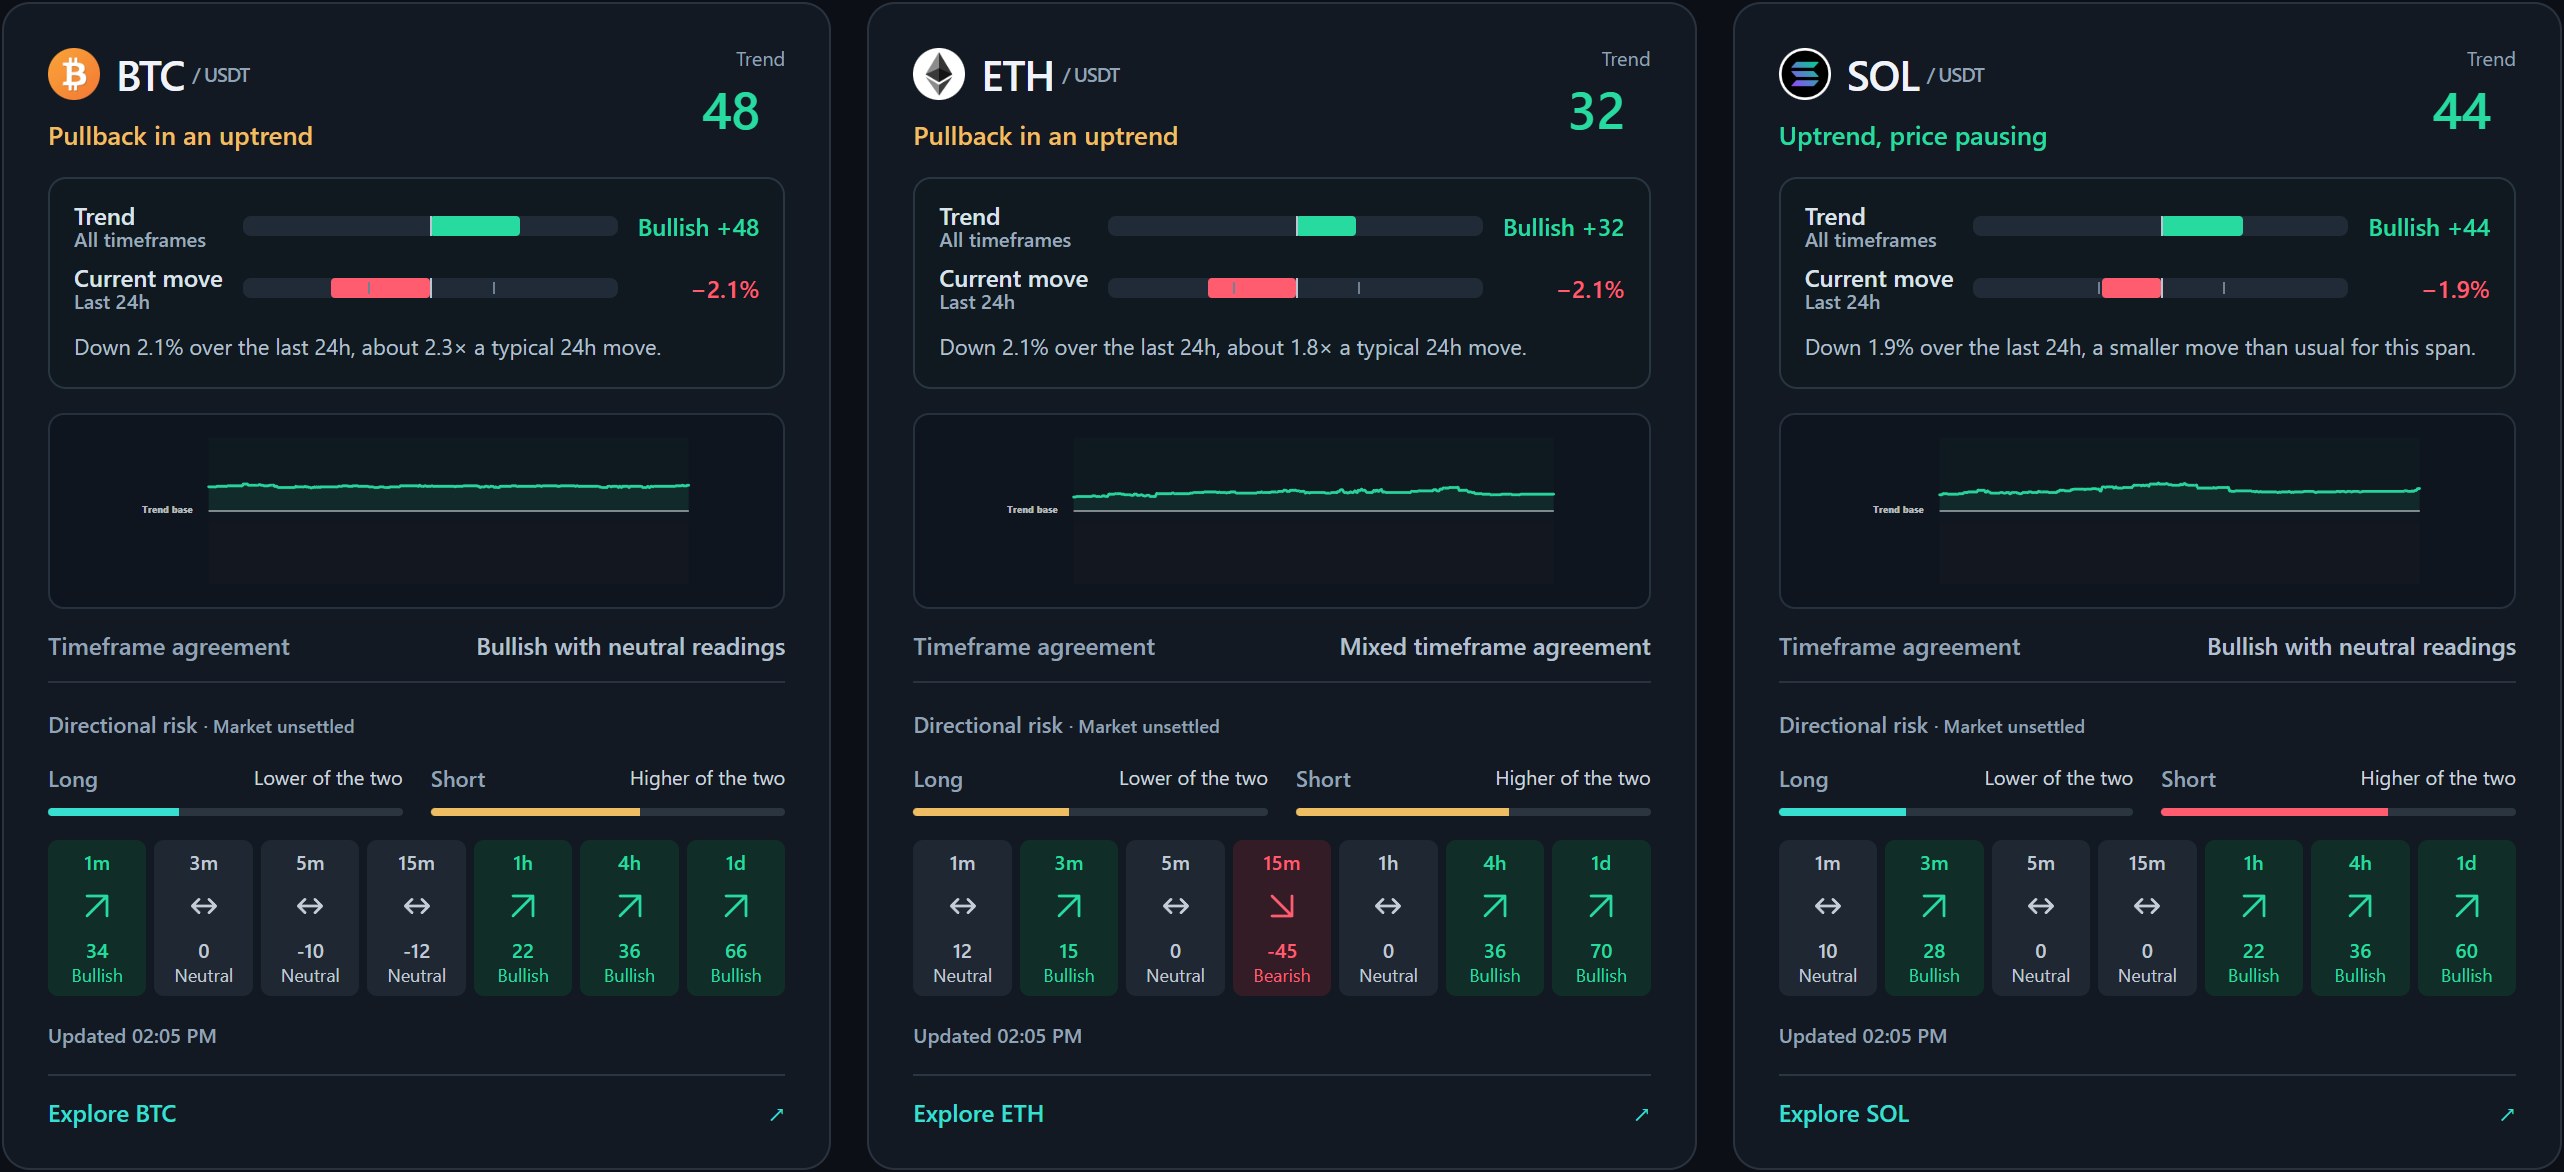
Define the comparison first
“Altcoin” commonly refers to a cryptocurrency other than Bitcoin. For a market comparison, the label is less useful than the actual asset and pair: ETH/USDT and SOL/USDT describe different markets, and ETH/BTC asks a different question again.
Choose the same start and end times when comparing percentage moves. A 24-hour BTC change and a two-day ETH change are not a fair same-period comparison, even if they appear next to each other on different screens.
Relative performance with a simple calculation
Suppose BTC rises 5% and ETH rises 3% over exactly the same window against the same quote asset. Both increased, but ETH underperformed BTC in that window. Its relative change is approximately (1.03 ÷ 1.05 − 1) × 100, or −1.9%.
The calculation illustrates relative performance, not a live quote or a prediction of the next period. It also shows why subtracting the two headline percentages is only an approximation. If the quote currencies differ, you need to account for that before making the comparison.
A Trendium score is not a return ranking
The app’s watchlist example shows combined scores of +48 for BTC, +32 for ETH and +44 for SOL. Those are readings of market pressure, not percentages gained. They do not establish that BTC returned 48% or that ETH is undervalued.
In the same screenshot, BTC and ETH both have a −2.1% current move over 24 hours, while SOL shows −1.9%. The trend score, price move and timeframe agreement each describe different parts of the market. Read the headings before comparing the numbers.
Look for a specific difference, not a market-wide story
Ask whether the coins have the same direction across broad timeframes, whether short readings differ, and whether the current move is unusually large for each market. Matching negative daily returns can still come with different timeframe patterns.
A few watchlist cards do not prove “altcoin season,” a measured correlation or a shift across the entire crypto market. Trendium’s overview is not a market-cap dominance index or a statistical correlation matrix. Keep those larger claims separate from the readings you have.
A repeatable comparison note
Record each market’s pair, observation window, percentage move, combined reading, timeframe agreement and directional warnings. Put BTC beside ETH or SOL, and describe one concrete similarity and one difference. Revisit the same comparison later without changing the time window to favor a particular conclusion.
Start with the Bitcoin guide, then the Ethereum or Solana example. Trendium helps organize observations; it does not identify the best investment, guarantee diversification or rank future returns.