 Trendium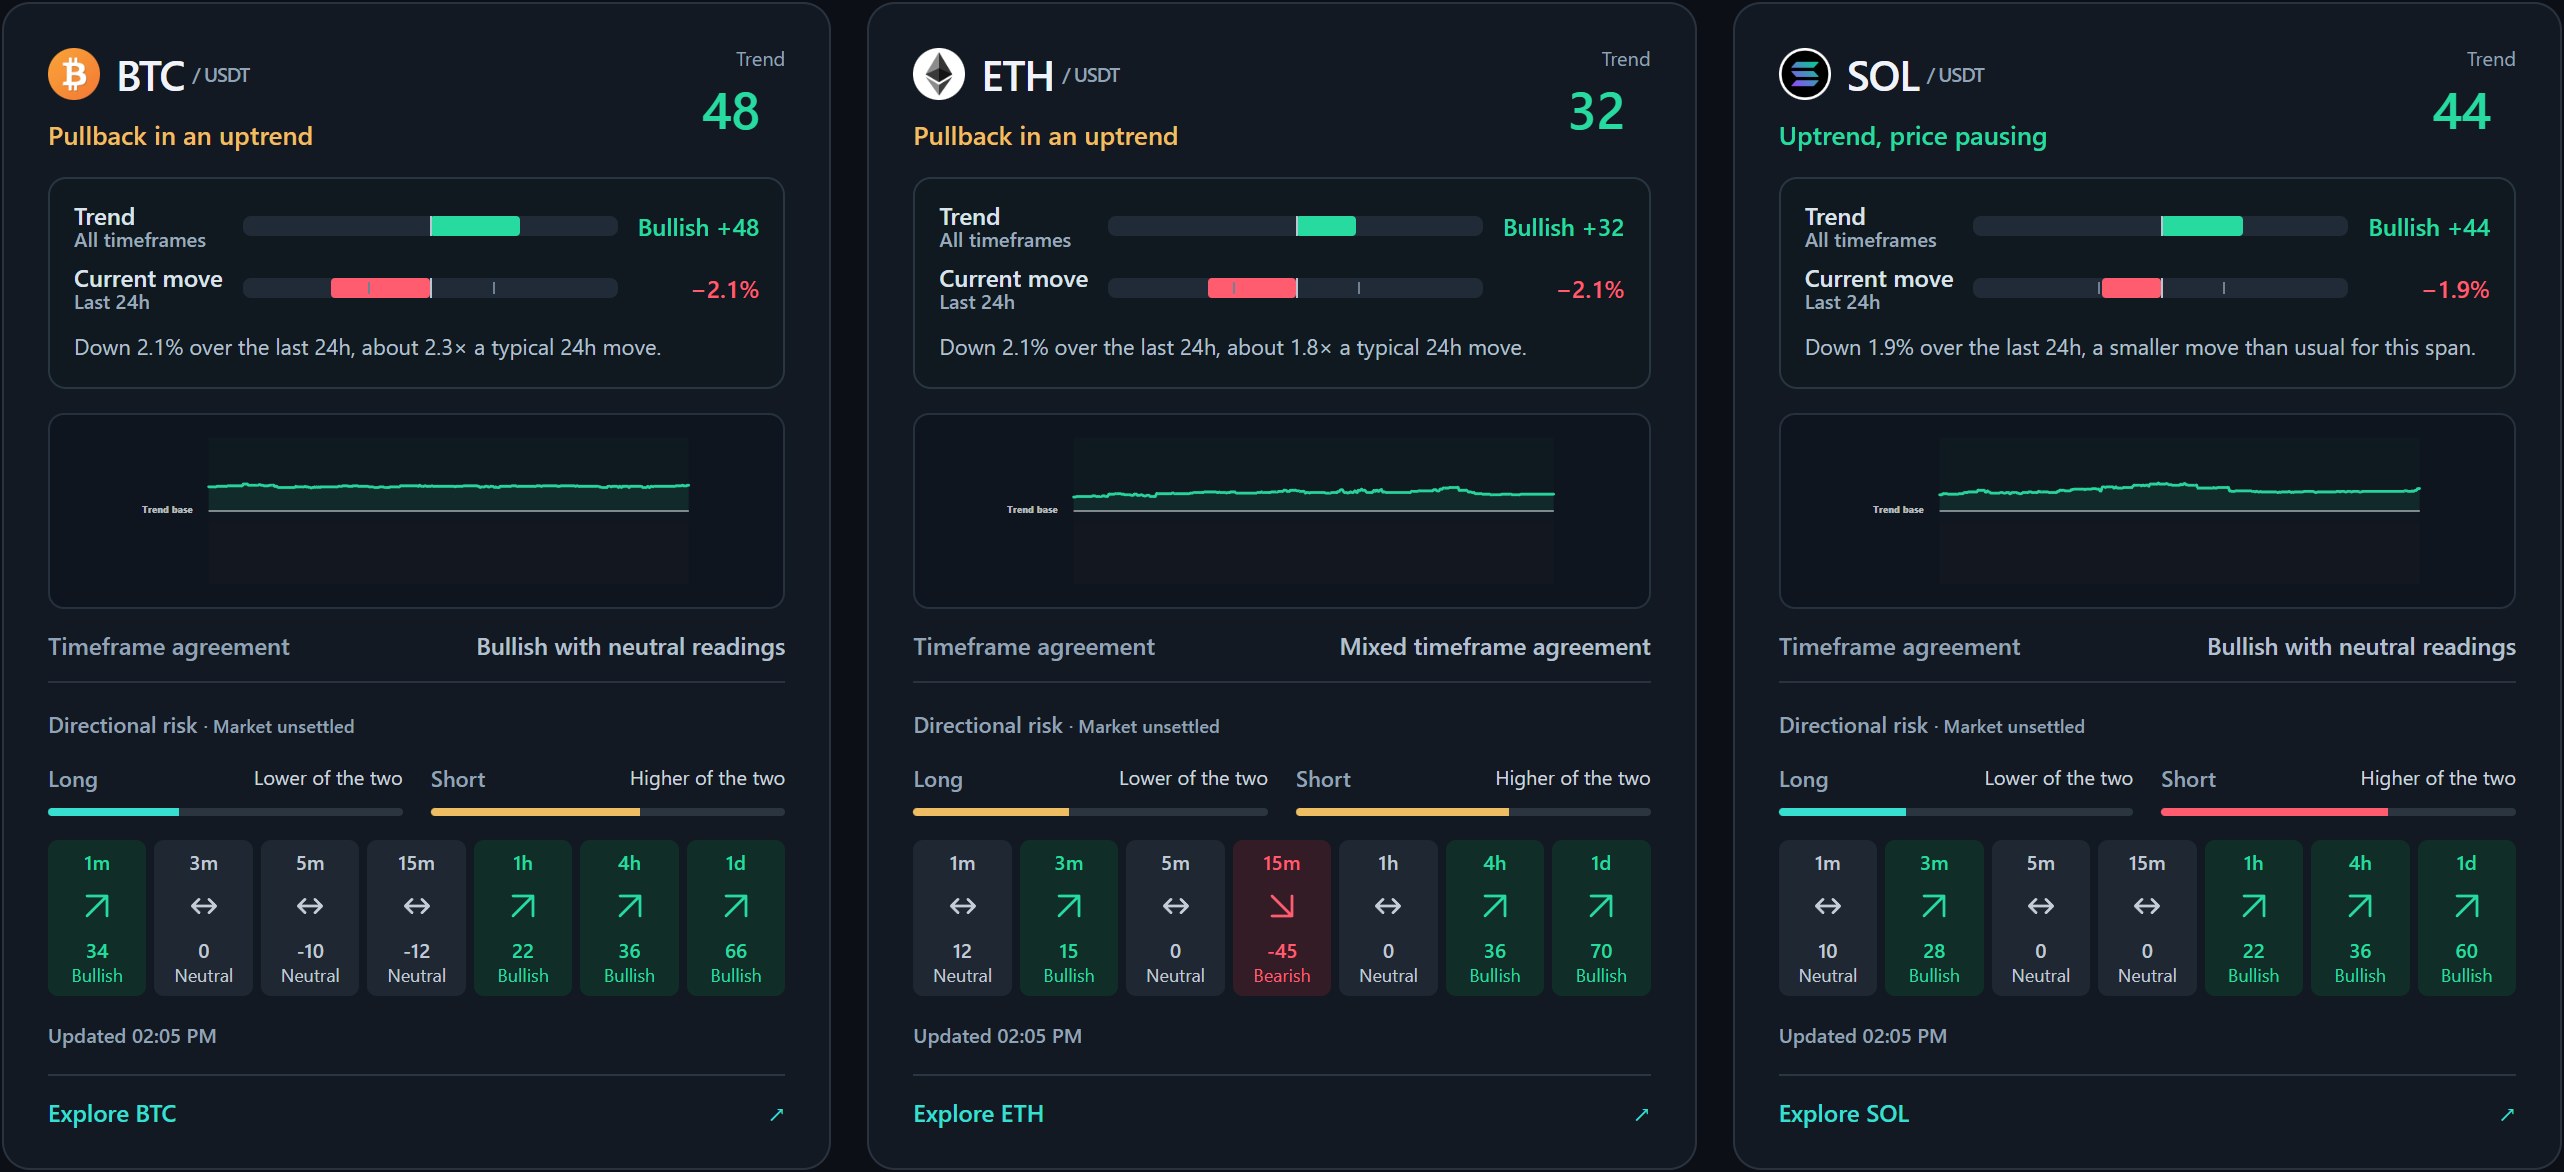
Volatility describes movement; liquidity concerns execution
Volatility concerns how prices vary. Liquidity concerns the ability to buy or sell without substantially moving the market price. A busy-looking chart does not by itself tell you how much can be traded at the displayed price.
Slippage is the difference between an expected trade price and the price actually executed. Low liquidity, fast movement, order size and delays can contribute. Kraken’s slippage explanation distinguishes these factors.
The same percentage can mean different things
A 2% move may be unusual for one market over a particular window and ordinary for another. Comparing the headline percentages without their normal movement or period can miss that difference.
The Trendium overview example makes this visible: BTC’s −2.1% daily move is described as about 2.3 times a typical move, while SOL’s −1.9% move is described as smaller than usual for that span. These captured readings illustrate relative context, not a fixed rule about how BTC or SOL always behaves.
An order-book example
Imagine the nearest offer is 1.00 in the quote asset, but only a small quantity is available there. A larger market order could also consume offers at 1.01 and 1.02. Its average execution price would differ from the first displayed offer.
This is a simplified example, not a current order book or a suggestion to place an order. It shows why the latest quote is not a promise that every quantity can transact at that price.
Meme-coin attention does not answer liquidity questions
DOGE, SHIB, PEPE and BONK are distinct markets, and liquidity can differ by venue, pair and time. A popular ticker does not tell you the depth available on the particular venue you are inspecting. Newly launched tokens can require a very different data review from established exchange instruments.
Use the meme-coin guide to distinguish asset identity and social attention from the market reading. Do not treat a large reported percentage gain as a complete description of its risks.
Where Trendium fits
Trendium helps put the current move beside trend pressure, seven timeframes, combined history and directional warnings. That can make the price movement easier to describe, but it is not an order-book depth screen or an estimate of your execution price.
The app does not place trades or measure every liquidity and custody risk. Read the risk explanations as warnings about the displayed market conditions, then keep other questions separate. The observation checklist is a way to practice that separation without entering an order.